Cody Thomas1, Alexander Byer-Alcorace1, Stephanie Piekos1, Jessica R. Weaver2, Justin J. Odanga2, Kristina K. Wolf3, Jingsong Chen2, Jung Bok Lee2, Edward L. LeCluyse3 and Mitchell E. Taub1
1Non-Clinical DMPK, Boehringer Ingelheim Pharmaceuticals, Inc., 900 Ridgebury Road, Ridgefield, CT 06877; 2Institute of Regenerative Medicine, LifeNet Health, 1864 Concert Drive, Virginia Beach, VA 23453; 3Research and Development, LifeSciences, LifeNet Health, 6 Davis Drive, Research Triangle Park, NC, 27709
Background
Assessing in vitro hepatic clearance and identifying enzymes involved in metabolism is an important part of characterizing drug candidates in development. However, challenges exist for current in vitro models and can include enzyme levels and ratios of expression that are not physiologically relevant, as well as suspension culture durations limited to a 4–6-hour incubation, which is not long enough to accurately evaluate the clearance of slowly metabolized compounds.
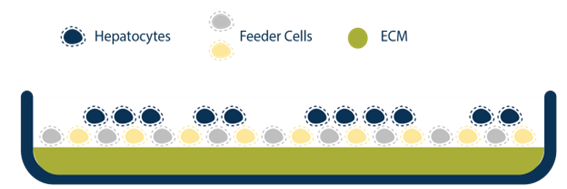
There have been advancements with novel hepatic models such as spheroids, organoids, and microfluidic systems that help address these current limitations, but these systems also require a high level of expertise to develop, operate, and maintain. The human hepatocyte tri-culture system (TCS), developed by LifeNet Health LifeSciences, may be a useful tool to help overcome some of these challenges. The TCS is comprised of three types of entirely human cells (primary hepatocytes and primary human “feeder” cells, including hepatic endothelial and stromal cells). The TCS is designed to extend culture duration while maintaining cell viability, functionality, and metabolic capability. The overall goal of this study was to characterize functionality and enzyme activity of major CYPs and UGTs in the TCS over several weeks.
Experimental Methods
Assess basic functionality of the TCS and culture establishment
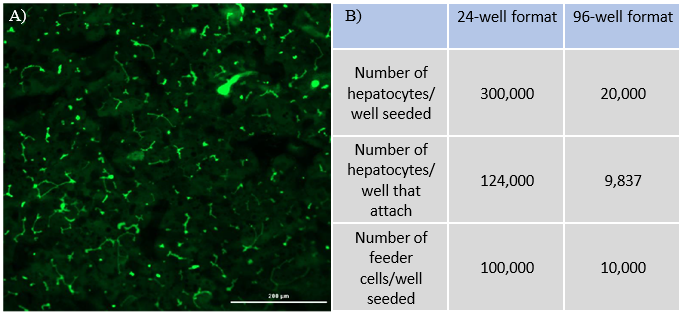
Compare 24-well and 96-well formats
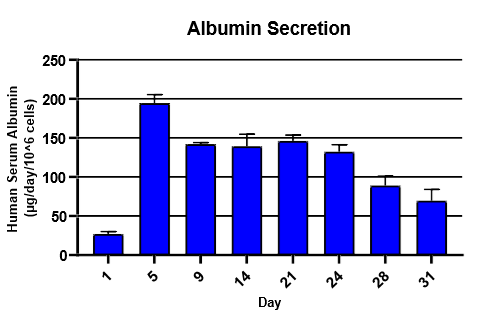
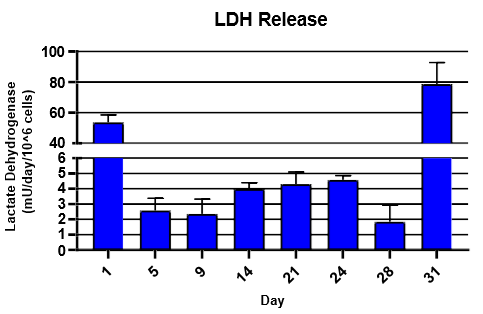
Monitor hepatic health by measuring albumin and lactate dehydrogenase (LDH) production for 24 hrs at each timepoint over 31 days
Albumin was detected using Abcam Human Albumin Simple Step Elisa® Kit
LDH was detected using Promega LDH-Glo Cytotoxicity® Kit
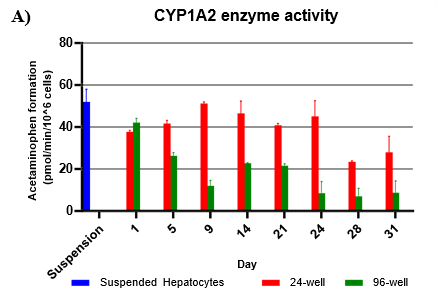
Assess CYP and UGT activity by administering test compound and monitoring metabolite formation over a 60-min incubation over 31-days
Metabolites were quantified using LC-MS/MS
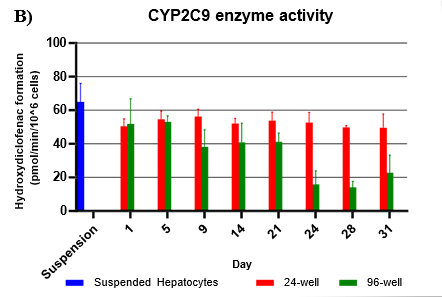
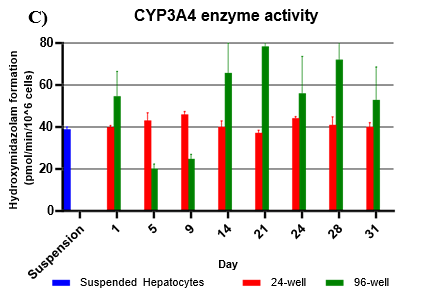
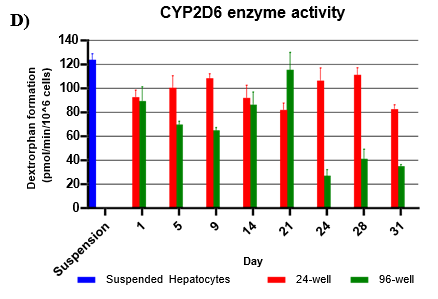
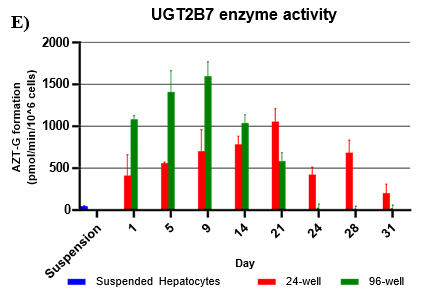
Activity rates were compared to that of suspended hepatocyte (same donor lot) incubated at 0.5 million cells/mL
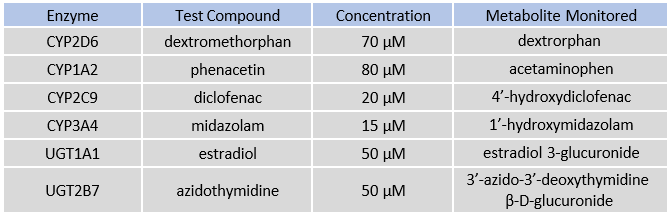
Table 1. CYP and UGT enzymes tested with specific probe substrates indicated. Reactions were quantified by monitoring metabolite formation over 30 minutes in suspended hepatocytes, 24-well, and 96-well TCS formats.
Hepatic Function
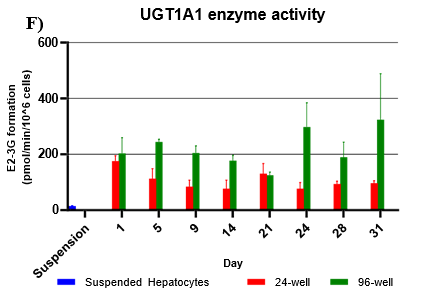
Assessment of CYP and UGT enzyme activity over 31 days
Conclusions
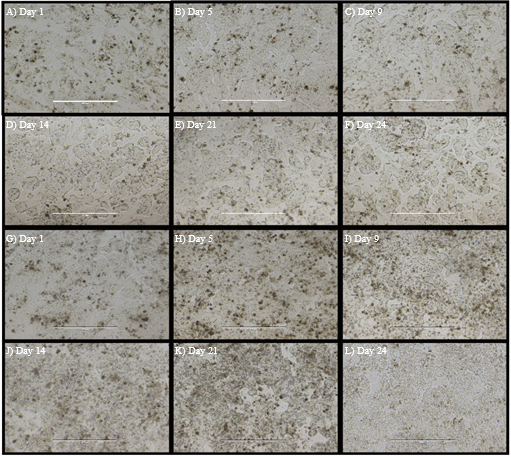
TCS hepatocytes generally appeared healthy and exhibited high levels of albumin secretion and low levels of LDH production for ~4 weeks.
Hepatocytes in both 24-well and 96-well formats maintained CYP activity that was generally comparable to that of suspended hepatocytes for as long as 31 days in culture.
CYP activity was consistent over 31 days in the 24-well format. In the 96-well format, CYP activity was stable over 21 days but dropped by day 28 and 31. Feeder cells showed no metabolism of tested CYP and UGT probes indicating that metabolism was due to hepatocyte metabolism.
UGT activity was higher in TCS when compared to suspension hepatocytes, but also more variable when compared to CYP activity.