Stephanie Piekos1, Cody Thomas1, Alexander Byer-Alcorace1, Jessica Weaver2, Justin J. Odanga2, Kristina K. Wolf3, Jingsong Chen2, Jung Bok Lee2, Edward L. LeCluyse3, and Mitchell E. Taub1
1Non-clinical DMPK, Boehringer Ingelheim Pharmaceuticals Inc., Ridgefield, CT; 2Institute of Regenerative Medicine, LifeNet Health, Virginia Beach, VA; 3Research and Development, LifeSciences, LifeNet Health, Research Triangle Park, NC
Introduction
During drug development, novel chemical compounds are assessed for the potential to induce expression of major cytochrome P450 (CYP) enzymes in vitro, typically in sandwich cultured primary human hepatocytes (PHH). While PHH, in combination with regulatory guidelines, can often reasonably predict clinical induction risk, it is still not well understood how newer, more advanced hepatocyte models perform when assessing CYP induction. In this study, a novel, all-human cell-based hepatocyte triculture system (TCS) was assessed for both the basal expression levels of major CYPs and nuclear receptors, as well as induced levels of CYPs in response to treatment with prototypical inducers. These results define fundamental baseline data for future use of the TCS in in vitro induction studies and provide insight into where the TCS may be able to overcome challenges observed with PHH, such as induction of CYP2C enzymes.
Methods
Evaluation of basal expression of genes over a 4-week culture period
PHH and feeder cells were plated on 24-well collagen-coated plates to establish the TCS
At specified time points over the course of 4 weeks, wells were treated with TRIzol reagent to lyse cells
RNA was isolated using chloroform extraction, and cDNA was generated using the SuperScript IV VILO Kit
Gene expression was evaluated using a TaqMan array card assay on a QuantStudio 7 Real-Time PCR System. Fold induction was calculated using the ΔΔCt method compared to Day 1 expression.
Evaluation of CYP expression in response to treatment with prototypical inducers
PHH and feeder cells were plated on a 96-well collagen-coated plate to establish the TCS
On Day 10 of culture, media containing varying concentrations of prototypical inducers (0.1% DMSO) was added to wells (Table 1)
Cells were exposed to inducer for 48 h, with the addition of fresh media and inducer after the first 24 h
After 48 h, media was removed, and RNA was collected from each well using the mRNA Catcher PLUS Purification Kit
cDNA was generated using the SuperScript IV VILO Kit, and gene expression evaluated using TaqMan probes assays on a QuantStudio 7 Real-Time PCR System. Fold induction was calculated using the ΔΔCt method compared to vehicle controls.
Emax and EC50 values were determined by fitting the data to a sigmoidal model using GraphPad Prism
Table 1. List of CYPs evaluated for induction potential in response to treatment with specified prototypical inducer
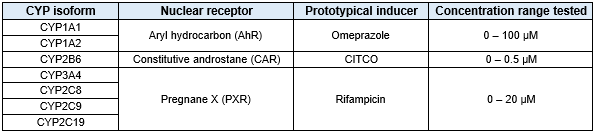
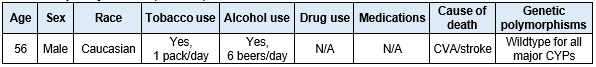
Table 2. Hepatocyte donor (1921756) information
Results
Determination of appropriate housekeeping genes to utilize for studies in TCS
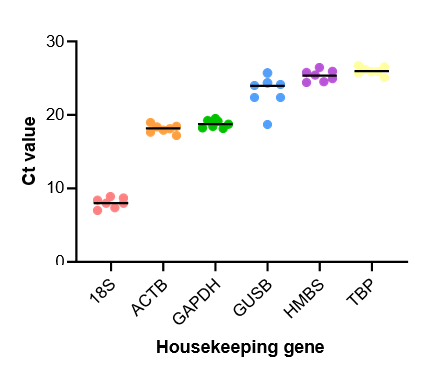
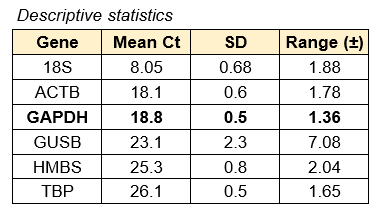
Figure 1. Evaluation of the expression of various housekeeping genes over 4 weeks in culture. Each circle represents gene expression on either Day 1, 4, 7, 12, 17, 23, or 30. GAPDH was selected as the ideal housekeeping gene due to consistency in Ct values over the course of the incubation.
Basal expression of CYPs and nuclear receptors in the TCS over 4 weeks in culture
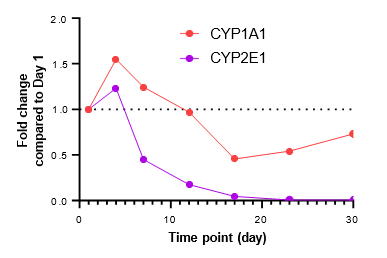
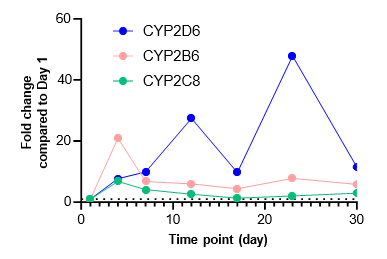
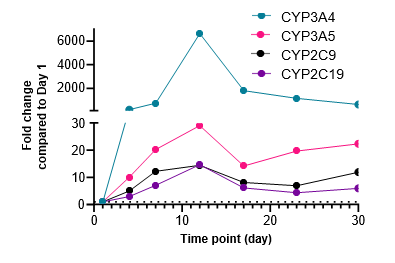
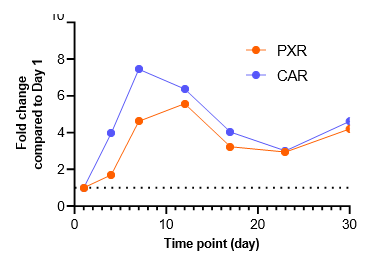
Figure 2. Gene expression of each CYP and nuclear receptor was determined in the TCS on different days over a 4-week culture period under basal conditions. Expression on each day is represented as fold change in comparison to expression levels on Day 1. As most genes reach their highest expression levels between Days 7 – 12, the subsequent induction study in the TCS was initiated on Day 10.
Induction potential of major CYPs following exposure to prototypical inducers for 48 h
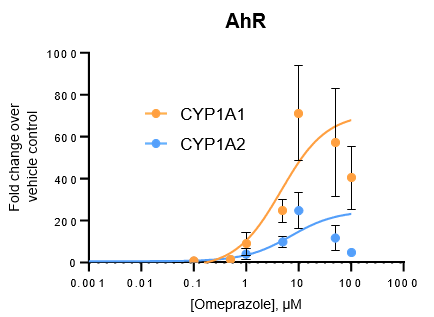
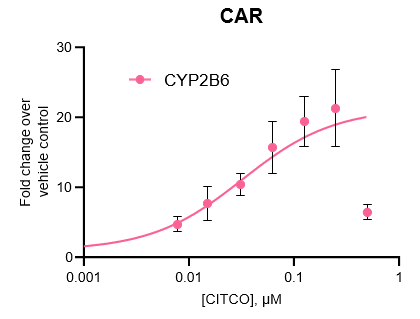
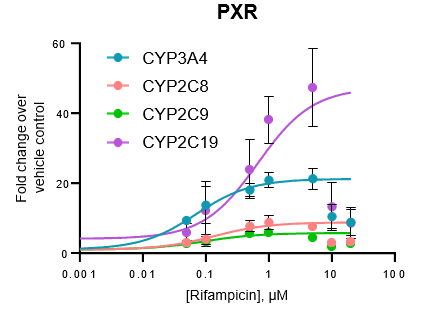
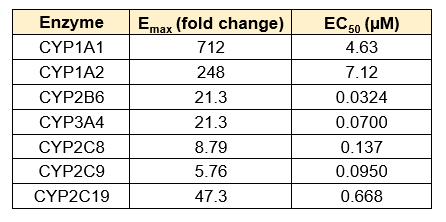
Figure 3. Gene expression of each CYP was determined in the TCS following treatment with a range of concentrations of various prototypical inducers for 48 h. Expression is represented as fold change in comparison to vehicle control (n = 4), and Emax and EC50 values for each enzyme were determined by constraining curves to the highest fold change value observed.
Conclusions
There is a substantial surge in the expression of CYP enzymes (except for CYP1A1 and CYP2E1) and nuclear receptors up to 4-12 days after establishing the TCS
The expression of most genes tested reach maximal levels in the TCS between Days 7 – 12
All major CYP enzymes are highly inducible in the TCS in response to prototypical inducers, including the CYP2C enzymes
Induction potential was observed to decrease at the highest levels of inducers tested for all major CYPs