Justin J. Odanga1, Erick K. Breathwaite1, Sharon Presnell1, Edward L. LeCluyse2, and Jessica R. Weaver1
1Institute of Regenerative Medicine, LifeNet Health, 1864 Concert Dr., VA Beach, VA, and 2Research and Development, LifeNet Health LifeSciences, 6 Davis Dr., Research Triangle Park, NC
Abstract
Liver toxicity continues to be a major health concern. There are several liver diseases that can result from chemical exposure, including steatosis, alcoholic and nonalcoholic steatohepatitis. Conventional in vitro model systems lack the ability to sustain the basic morphology and functionality of primary human hepatocytes (PHHs) from both healthy and diseased tissues for extended periods of time or maintain phenotypic characteristics including differences in lipid accumulation and inflammatory responses. Recent development of a novel all-human cell-based triculture system (hTCS) includes cryopreserved primary human feeder cells (FCs) and PHHs. The hTCS was used to characterize basic synthetic and metabolic functions in PHHs from healthy and diseased tissues, which were classified according to their histopathology score. hTCSs were established by thawing cryopreserved human feeder cells (FCs) and seeding onto 24-well collagen coated plates. Cryopreserved adult PHHs from either healthy or diseased donors were then thawed and plated onto the FCs to create the hTCS. The functionality of both healthy and diseased PHHs cultured in the hTCS was measured during a 15-day culture period, including production of albumin (Alb) and urea and Cytochrome P450 (CYP) 3A4 activity when normalized to cell number. The results showed a decrease in Alb levels from the diseased PHHs (40.6 ± 10.8 µg/106/day) in the hTCS compared to healthy PHHs (111 ± 22.2 µg/106/day) on day 15 of the culture period. A similar decrease was measured for urea levels (37.4 ± 1.83 vs 74.5 ± 5.08 µg/106 cells/day). There was also a 5-fold decrease in CYP3A4 activity in diseased PHHs (25.9 ± 8.6 nm/106 cells/day) versus healthy PHHs (126 ± 5.84 nm/106 cells/day) on day 15. Immunolocalization of CYP2E1 was notably elevated in diseased PHHs compared to healthy PHHs. Characterization of pro-inflammatory cytokine expression of MCP-1 and IL-6 in both healthy and diseased hTCS systems was also determined on day 14. When cultured with diseased PHHs compared to healthy PHHs on day 14, there was an increase in IL-6 (68.5 ± 16.4 vs 21.1 ± 9.74 pg/106 cells/day) and MCP-1 (8886 ± 2195 vs 3482 ± 1484 pg/106 cells/day). The fibrotic marker CK18 was increased in the hTCS when cultured with diseased PHHs (15224 ± 3568 pg/106 cells/day) versus healthy PHHs (9462 ± 2460 pg/106 cells/day) on day 14. TGF-β expression was also higher in the diseased PHHs (753.4 ± 322.4 pg/106 cells/day) versus the healthy PHHs (439.5 ± 205.4 pg/106 cells/day). Gene expression of FASN, PCK1, and G6PC in the diseased PHHs at day 14 was decreased almost 3-fold on average compared to the healthy PHHs. Further characterization of the hTCS was performed by determining the differences in the synthesis and accumulation of intracellular lipid by healthy and diseased PHHs maintained in medium containing 320 µM oleic acid and 25 mM glucose (lipotoxic med.). An increase in lipid synthesis was measured after both types of PHHs were cultured in lipotoxic med. (diseased: unt 100 ± 11.8% vs trt 120.6 ± 9.11%; healthy: unt 100 ± 5.58% vs trt 145.3 ± 8.49%). Adding 0.5 µM Obeticholic acid (OCA), a farnesoid X receptor agonist, significantly decreased lipid synthesis by 15% on day 7 of treatment in healthy PHHs cultured in lipotoxic med. in the hTCS (trt 115.4 ± 5.82 vs trt + OCA 97.5 ± 5.66%). In conclusion, diseased PHHs maintained in the hTCS over 14 days showed characteristic differences in functionality and lipid disposition compared to normal PHHs indicating that the hTCS represents a promising new platform that can be used to study lipotoxic mechanisms in healthy and diseased populations due to the preservation of phenotypic differences over a prolonged culture period.
Introduction
There are existing limitations for finding suitable disease culture models or systems that can mimic an accurate diseased phenotype and maintain diseased characteristics including lipid accumulation and inflammation. Accumulation of lipids in PHHs by lipogenesis or other means can eventually result in steatosis and insulin resistance. The excess FFAs in the liver can lead to an increase in reactive oxygen species (ROS)1. Overproduction of ROS activates immune cells leading to inflammation and liver injury. Macrophages can also be recruited and begin to secrete inflammatory cytokines and cause an increase in collagen-1 and tumor growth factor-β (TGF-β), which leads to deposition of the extracellular matrix and fibrosis. Because of these challenges, treatments for liver disease have been difficult to develop. Recently, the Farnesoid X Receptor agonist Obeticholic Acid (OCA) has been tested in clinical trials for treatment of liver disease, including steatosis, inflammation, and fibrosis.2 Through the use of the hTCS, diseased PHHs were cultured for 15 days and exhibited a fatty morphology. They showed decreased function and increased inflammation. Markers for fibrosis were also present. These diseased characteristics were present and maintained during the culture period, showing the potential of the hTCS to be used as a disease model system.
Materials and Methods
Figure 1. Setting up the TCS
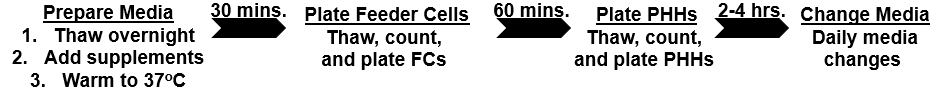
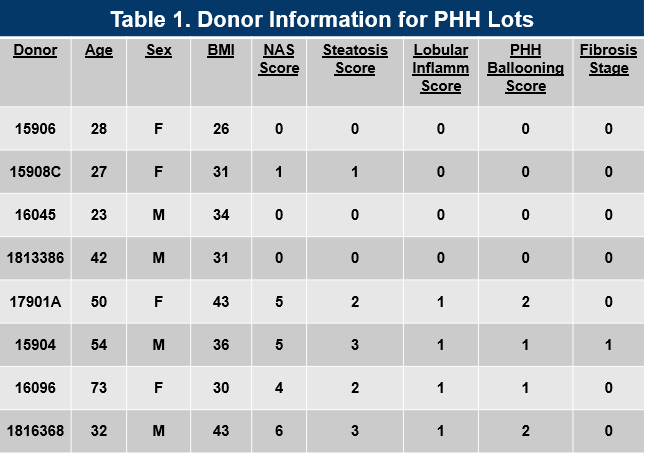
Table 1. Donor Information for Primary Human Hepatocyte Lots
Results
Figure 1. Morphology of Normal and Diseased PHHs. (A) Representative images of Normal (top row) and Diseased (bottom row) PHHs in the hTCS on days 7, 10, and 14. (B) Representative images of Nile Red Staining of Normal (top row) and Diseased (bottom row) PHH on day 14 in the hTCS. Magnification: 10X.
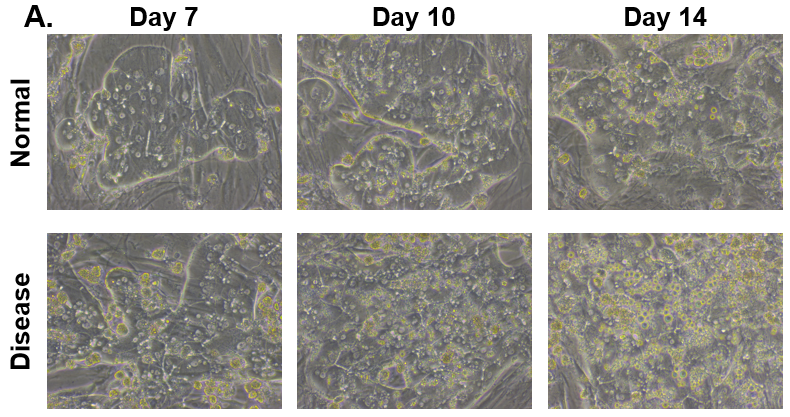
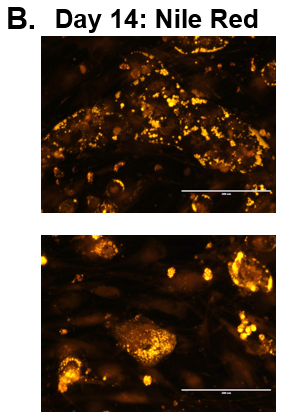
Figure 2. Functionality of Normal and Diseased PHHs. (A) Albumin and (B) Urea levels of Normal (grey bar) and Diseased (black bar) PHHs in the hTCS on day 14. (C) CYP3A4 activity of Normal (grey bar) and Diseased (black bar) PHHs on day 14. Error bars represent standard deviation (n ≥ 3 wells).
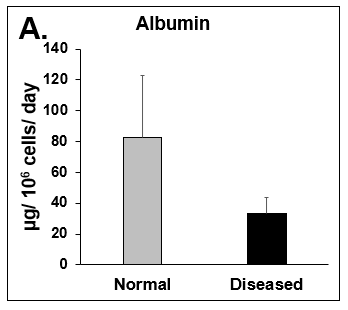
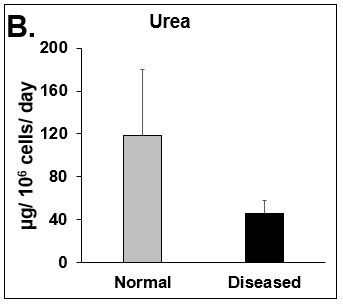
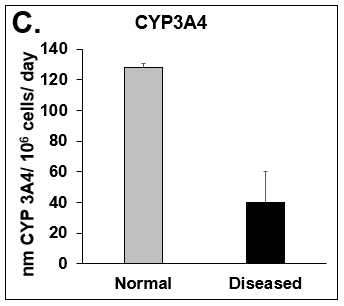
Figure 3. CYP2E1 Expression in Normal and Diseased PHHs. (A) Staining for CYP2E1 (red) expression and DAPI (Blue) with the merged image shown (blue and red) on day 15. (B) ROS expression in Normal (top row) and Diseased (bottom row) PHHs in the hTCS on day 3.
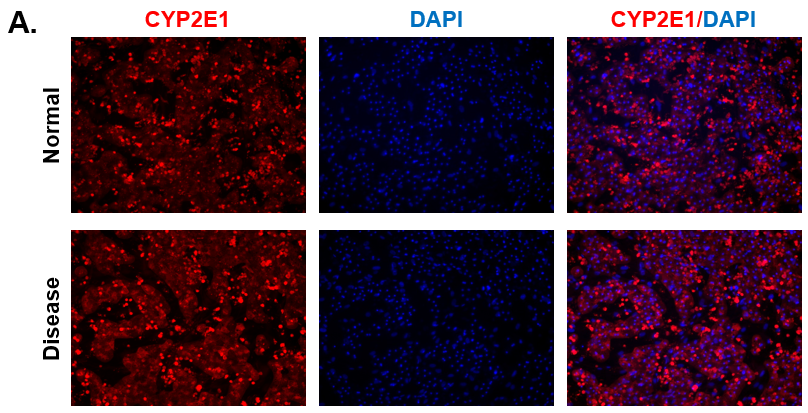
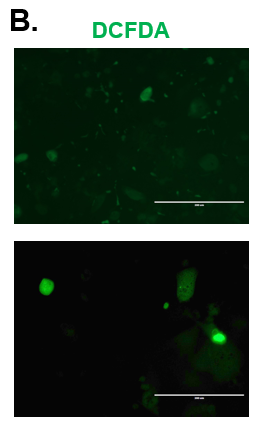
Figure 4. Expression of pro-inflammatory cytokines and fibrotic markers. Levels of (A) IL-6, a pro-inflammatory cytokine, and (B) MCP-1, a pro-inflammatory chemokine, in Normal (grey bar) and Diseased (black bar) PHHs in the hTCS on day 14. The fibrotic markers of (C) CK-18 and (D) TGF-β were measured in Normal (grey bar) and Diseased (black bar) PHHs on day 14. Error bars represent standard deviation (n ≥ 3 wells).
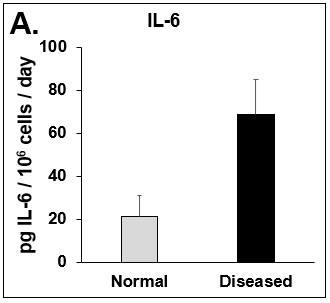
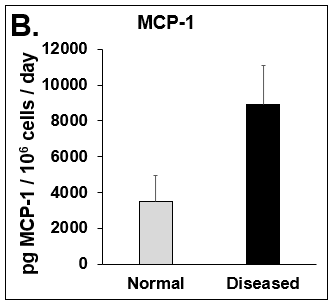
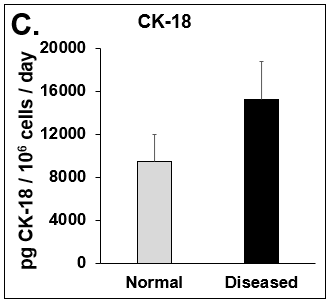
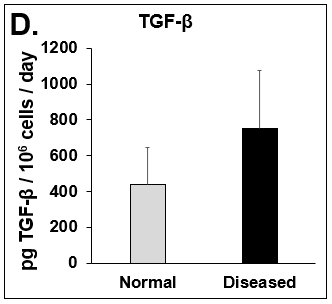
Figure 5. Differences in lipogenesis and gluconeogenesis. C(t) values of (A) Fatty Acid Synthase (FASN), (B) Phosphoenolpyruvate Carboxykinase (PCK1), and (C) Glucose-6-phosphatase (G6PC) on day 14 from Normal (circles) and Diseased (squares) PHHs in the hTCS. Errors bars represent standard deviation (n ≥ 3 wells).
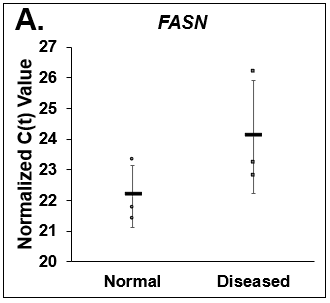
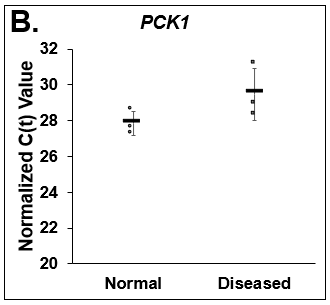
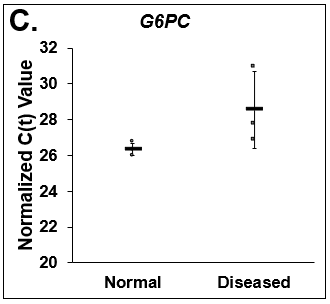
Figure 6. Increase in lipid synthesis when treated with lipotoxic media (25 mM glucose and 320 µM Oleic acid). Normal (top row) and Diseased (bottom row) PHHs treated with high glucose and Oleic acid in the hTCS. (B) Quantitation of Nile Red staining on day 14 in Normal (grey bars) and Diseased (black bars) PHHs. Error bars represent standard deviation (n ≥ 3 wells).
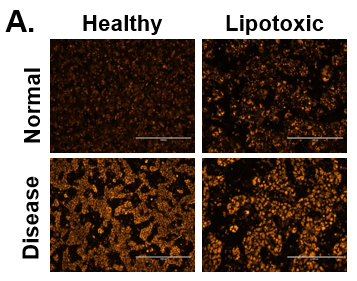
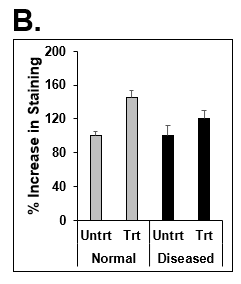
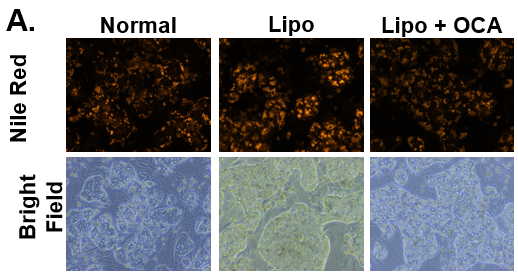
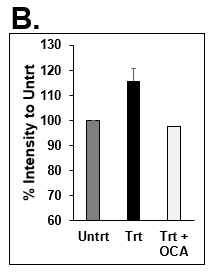
Figure 7. Decrease in lipid synthesis when treated with lipotoxic media (25 mM glucose and 320 µM Oleic acid) plus OCA (0.5 µM). Normal PHHs in hTCS media (normal), treated with high glucose and Oleic acid without (Lipo) and with OCA (Lipo + OCA). (B) Quantitation of Nile Red staining on day 7 in untreated (dark grey bar), lipo media treated (black bar), and lipo media treated with OCA (white bar) PHHs. Error bars represent standard deviation (n ≥ 3 wells).
Conclusions
- Hallmark features of disease were significantly more prevalent in the hTCS with disease-origin PHHs, including decreased hepatocellular function, increased lipogenesis, pro-inflammatory cytokine production, and fibrogenesis.
- The hTCS model system responds to known pathogenic stimuli (high glucose + high free fatty acids) by displaying disease-associated features within a 14-day culture period.
- Treatment with a known modulator of hepatic steatosis (OCA) reduced lipid accumulation in the hTCS, demonstrating suitability of the system for assessment of interventional strategies.
References/Acknowledgements
1. Ghemrawi, R., Battaglia-Hsu, S-F., and Arnold, C. Endoplasmic Reticulum Stress in Metabolic Disorders. Cells. 7, 63 (2018).
2. Younossi, Z.M. et al. Obeticholic acid for the treatment of non-alcoholic steatohepatitis: interim analysis from a multicentre, randomised, placebo-controlled phase 3 trial. Lancet. 394, 2184-96 (2019).