Eda Rogers1, Mercedes Biven2, Kristina K. Wolf1, Tammy Stone1, Pergentino Balbuena1, Jessica R. LaRocca2, Edward L. LeCluyse1
1LifeNet Health LifeSciences, Research Triangle Park, NC; and 2Corteva Argiscience, Indianapolis, IN.
Abstract
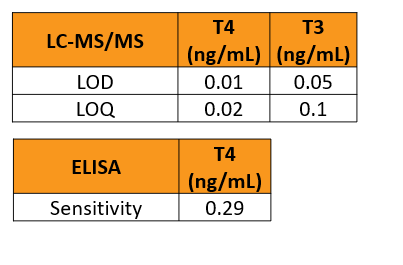
Deisenroth et al. recently described a novel 3D human thyrocyte microtissue culture platform for identifying TDCs whose toxicity may occur through various modes of action (Toxicol. Sci. 2020;174:63-78). The aim of this study was to further optimize 3D assay conditions including seeding density and exposure period for TDC testing based on thyroxine hormone production and quantitation using ELISA vs LC-MS/MS methods. Cryopreserved human thyroid epithelial cells (passage 1) from healthy adult donors of both genders ≤55 y.o. and a body mass index of ≤35 were cryopreserved in a serum-free bio-preservation medium. Thyroid cells from individual donors (N=3) were thawed in human thyrocyte plating medium (HTPM) and plated on Matrigel-coated 96-well culture plates at various seeding densities. The thyrocytes were maintained in a h7H-based culture medium containing 1mIU/mL bovine thyroid stimulating hormone (HTCM). Medium samples were collected at 14 days post seeding for thyroxine hormone measurements by LC-MS/MS or ELISA. The limit of detection (LOD) of T4 was 0.01ng/mL for LC-MS/MS and 0.781 ng/mL for ELISA. The results showed that thyroid microtissues seeded within a certain range of cells/well produced optimal levels of T4 and T3 with sufficient dynamic range (≥2.6) for TDC screening (≥ 1 ng T4 /day/106cells and ≥0.5 ng T3 /day/106 cells on day 14). Inhibition of T4 and T3 synthesis with the TPO inhibitor methimazole was determined after a 120-h treatment of 7500 cells/well between days 9 and 14 using LS-MS/MS analysis. Half-maximal inhibitory concentrations (IC50 ) for methimazole were 0.26 μM (T4 ) and 0.5 μM (T3 ), which aligned well with results using the ELISA method. Thyroxine hormone production analysis over time in culture using the LC-MS/MS method also suggested that testing TDCs can be started as early as day 5. In conclusion, LC-MS/MS provides a superior measure of thyroxine hormone compared to ELISA because of the lower limit of quantification (LOQ) and less error variance. As a result, an optimized treatment regimen requiring fewer primary human thyrocytes per well and a shortened culture period could be adopted for assessment of inter-individual effects of TDCs in sensitive or diseased populations.
Introduction
Environmental chemical exposure may cause thyroid dysfunction. Currently, US-EPA and ECHA/EFSA urge agrichemical industry to evaluate chemicals for potential thyroid disruption risks using human based in vitro cell models. The purpose of this study was to further optimize assay conditions of a novel 3D thyroid microtissue model including seeding density and exposure period for TDC testing based on thyroxine hormone production and quantitation using ELISA vs LC-MS/MS methods.
Materials and Methods
Table 1. Donor specifications
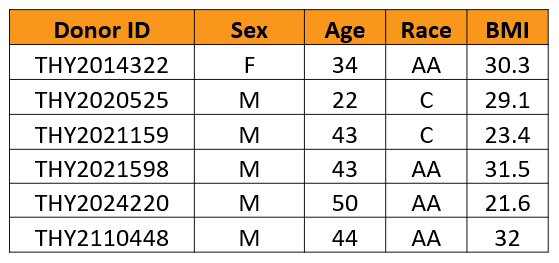
Table 2. Analytical sensitivity of LC-MS/MS and ELISA
Isolation of Human Thyroid Follicular Epithelial Cells
Thyrocytes were isolated from healthy thyroid tissues as previously described1 and cryopreserved. Monolayer cultures and 3D thyroid microtissues were prepared with cryopreserved PHT on TC-treated and Matrigel® (Corning) coated 96-well plates, respectively. Cell counting were assessed using acridine orange and propidium iodide (AO/PI) nuclear staining solution and Cellometer Vision system (Nexcelom). The 3D microtissue morphology was assessed over a 14-day period.
Treatments and Assays
The thyroid microtissues were treated with 0 or 1mIU/mL bovine thyroid stimulating hormone (TSH) (Sigma) from days 2-14. Cells were exposed to methimazole between days 9-14 in the presence of 1mIU/mL TSH. T4 synthesis was measured at select time points in collected media samples using ELISA kits (Invitrogen # EIAT4C) or LC-MS/MS at Corteva Agrisciences’ analytical laboratories.
Results
Figure 1. Schematic representation of PHT isolation and QC
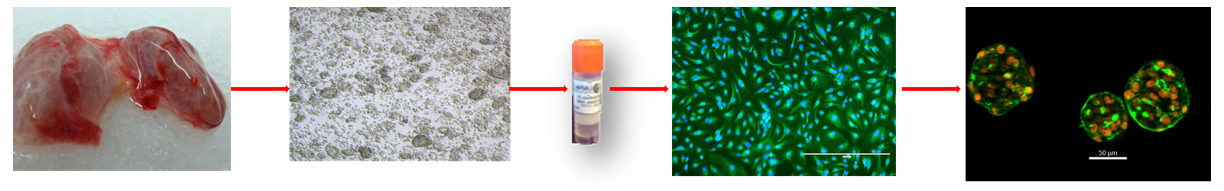
Figure 2. TSH-induced thyroxine hormone synthesis on day 14 in 3D cultures. The thyrocytes were treated with 0 or 1mIU/mL TSH starting on day 2. (Seeding cell density ~7.5E+03 cells per well). A. T4 levels were determined by ELISA. B. T4 and C. T3 levels were determined by LC-MS/MS.
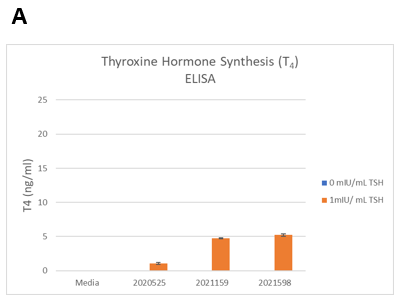
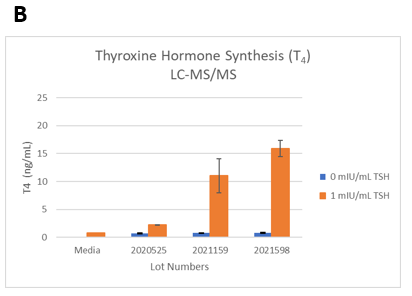
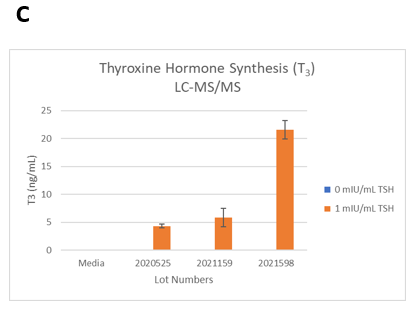
Figure 3. Identifying the lower limits of thyroxine hormones by LC-MS/MS. The thyrocytes were seeded at six different seeding densities (from 1.5E+04 to 2.5E+03 cells per well). A. TSH-induced T4 synthesis on day 14 from thyrocytes in 3D cultures was determined by LC-MS/MS. B. The dynamic range of T4 synthesis. C. Thyroxine hormone production levels normalized to 1M cells. D. Representative 3D thyroid microtissues on day 14 (Lot 2110448). Magnification:40X.
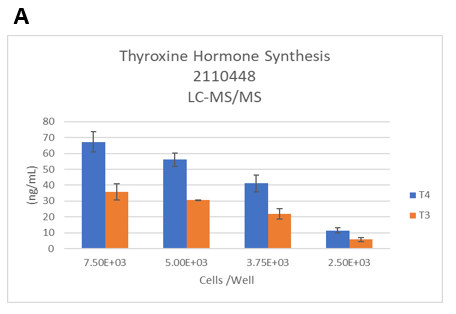
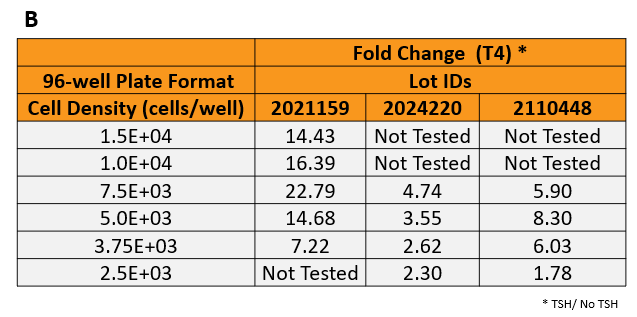
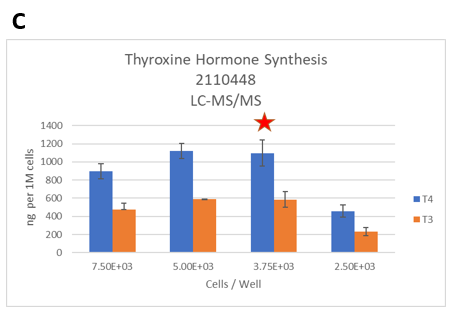
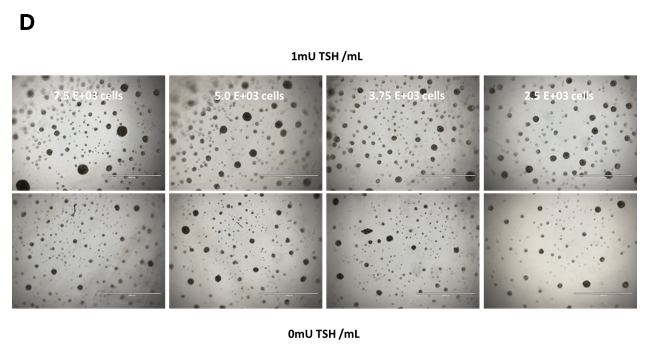
Figure 4. Determine ideal time points for screening TDCs. The microtissues were treated with 0 or 1mIU/mL TSH starting on day 2. (Seeding cell density 7.5E+03 cells per well). A. T4 levels were determined by ELISA (Lot 2014322). B. T3 and T4 levels were determined by LC-MS/MS. (Lot: 2021598) C. The dynamic range of T4 synthesis when thyrocytes are stimulated with bovine TSH.
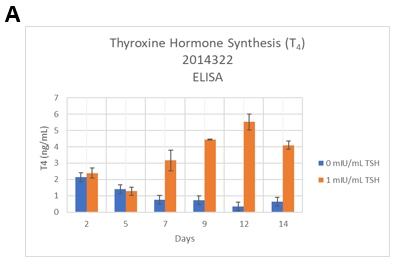
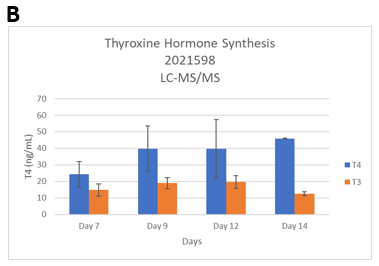
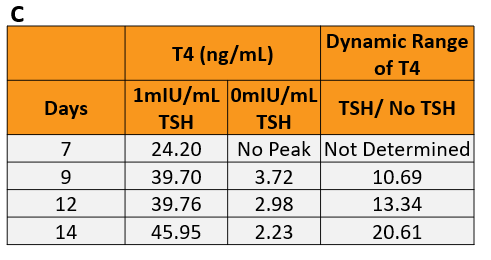
Figure 5. Lack of T4 synthesis from thyrocytes in 2D cultures when stimulated with bovine TSH.
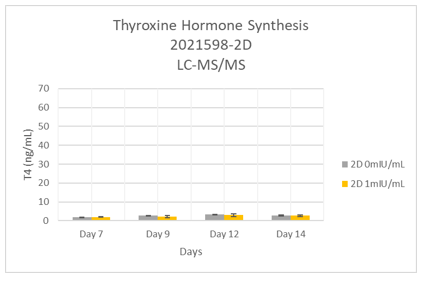
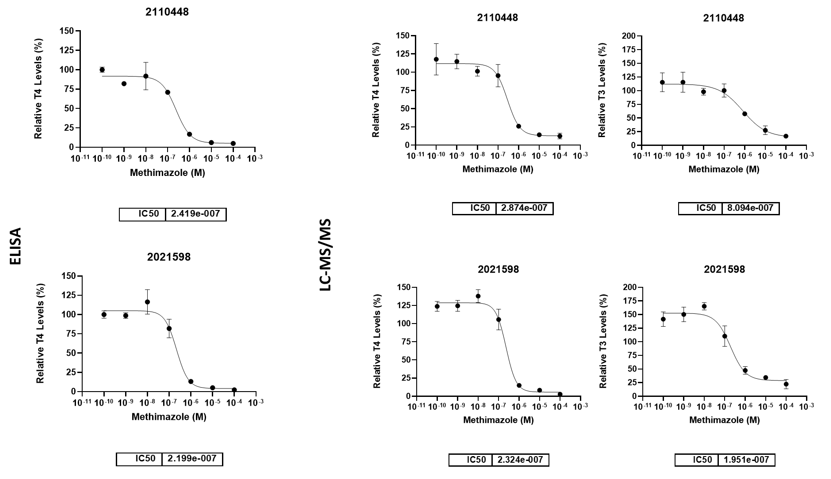
Figure 6. Inhibition of T4 synthesis by a TPO inhibitor, methimazole. Matured thyroid microtissues from three healthy donor tissues were exposed to methimazole (100pM to 100µM) from Day 9 to Day 14.
Conclusions
- LC-MS/MS is a more sensitive analytical method than ELISA to measure thyroxine hormone levels
- Thyrocytes synthesize both T3 and T4 in 3D cultures based on LC-MS/MS analysis, but not in 2D
- Dynamic range of T4 generated with LC-MS/MS analysis showed that optimal seeding density can be lowered to 3.75E+03 cells per well (7.5E+03 cells per well for ELISA)
- Optimal 3D thyroid microtissue size occurred at seeding densities from 7.5E+03 to 2.5E+03 cells per well
- Screening of TDCs can be started as early as Day 5 compared to Day 101 (Data from ELISA)
- IC50 values of methimazole for T4 inhibition were similar based on both ELISA and LC-MS/MS
References and Acknowledgements
- Deisenroth C et al. (2019) Development of an in vitro human thyroid microtissue model for chemical screening. Toxicol Sci 174: 63-78.
- ECHA and EFSA, et al. (2018) Guidance for the identification of endocrine disruptors in the context of Regulations (EU) No 528/2012 and (EC) No 1107/2009, EFSA Journal, 16 (2018), Article e05311.
We thank Gary Walters, Chris Cogswell and Danette Fuentes for assistance with tissue recoveries, and Stacey Hanson, Daniel Shuman, for assistance with logistics and poster arrangements.